

Hi Sales Navigator Admins and Program Managers,
As the administrator or Program Manager of your Modern Selling program, part of your role involves driving Sales Navigator adoption, assigning licenses, but also understanding how your teams are leveraging this platform on a daily, weekly and monthly basis.
Our Usage Reporting feature offers you a simple way to track Sales Navigator adoption, activity and effectiveness amongst your teams.
A few important things to bear in mind:
- You need to have ‘’Administrator’’ permissions to access this dashboard
- This reporting includes activity from LinkedIn.com as well as Sales Navigator to ensure all selling activity is reflected in reports. This activity may take place on desktop as well as on mobile, email, or CRM applications.
- Data is collected for usage reports from the day users complete their onboarding to the present date. By default, the usage reporting displays activity from the last 30 days.
- Sales Navigator activity will show up in Usage Reporting within 24 hours
- By default, Usage Reporting tracks activity on both Sales Navigator and LinkedIn.com. Users can opt to turn off LinkedIn.com activity tracking any time by visiting their Settings page in Sales Navigator (impacted metrics include: Days Active, Searches Performed, and Profile Views)
- Detailed SSI information (including a breakdown by SSI category) can be found in your report once exported to CSV
- Usage reporting shows the activity of all activated users. Users who have not completed Sales Navigator onboarding are not included in usage reporting. However, if you export usage reporting data to CSV, these users' names will appear in the CSV file, but the file will not include any activity data.
So, now, let’s dig into what the Usage Reporting dashboard offers and find out how you can maximize this dashboard to find and share the results you’re looking for.
Step 1: How to access Usage Reporting
If you’re a Sales Navigator Admin, you should see an ‘’Admin’’ option in your navigator bar. This feature is only available to users with Admin permission settings. If you believe you should have access, please contact your administrator.
Your usage reporting dashboard is organized into three important tabs:
- Overview
- Usage
- Effectiveness
Step 2: Leverage the Overview tab for seeing key metrics
The Overview tab gives a high-level snapshot of your team's seat allocation status and Coach level distribution. This is extremely helpful, since as an Admin you want to understand first if you’ve allocated and activated all your Sales Navigator seat and, secondly, what’s the level of Sales Navigator knowledge your reps have.
Seat Allocation Status
Here you can easily identify the number of Sales Navigator seats that have been Purchased, Assigned, and Activated within your account.
At Sales Navigator, we recommend the following best practices:
- Assign as many of your Purchased seats as possible. (Don’t worry -- you can always reassign seats later)
- Try to maintain a 100% Activation rate. Re-send invites to users who don’t activate their seats within a week
Coach level distribution
The Coach level distribution view lets you identify the number of users in your account that are considered Beginner, Intermediate, Proficient, Advanced, and Expert Sales Navigator users at a glance. Use Coach level distribution to identify whether or not different groups have taken the time to learn how to use Sales Navigator effectively or if they could still use further education. Use individual view in CSV export to identify who specifically may require additional training.
Step 3: Get to know how the Usage helps you customize your data
One of the features in Usage Reporting is the ability to select a custom date range and groups & users filters for each metric. As a Admin this will make your life easier, as you have the option to select the time frame you want to investigate and run your own reports.
Groups & Users Filters
The Groups & Users filters allow you to easily view how specific groups or individuals are using Sales Navigator. We recommend using these filters to easily create customizable reports, as well as compare how your different teams and regions stack up to each other.
Keep in mind that if you create a new group, then that group won't be immediately available in Usage Reporting. Changes to groups or team members will take up to 24 hours to appear in usage reporting.
Custom date range
The custom data range allows you to choose from one of the four preset ranges (last 7 days, last 30 days, last 90 days or last month), or customize your date range to see up to two years worth of past Sales Navigator data. You also have the option to export this to CSV and create your own Sales Navigator usage reports.
If you select more than 30 days, your date range will automatically update to include data for the full week. This may cause your Days active to be slightly higher that what you've originally selected.
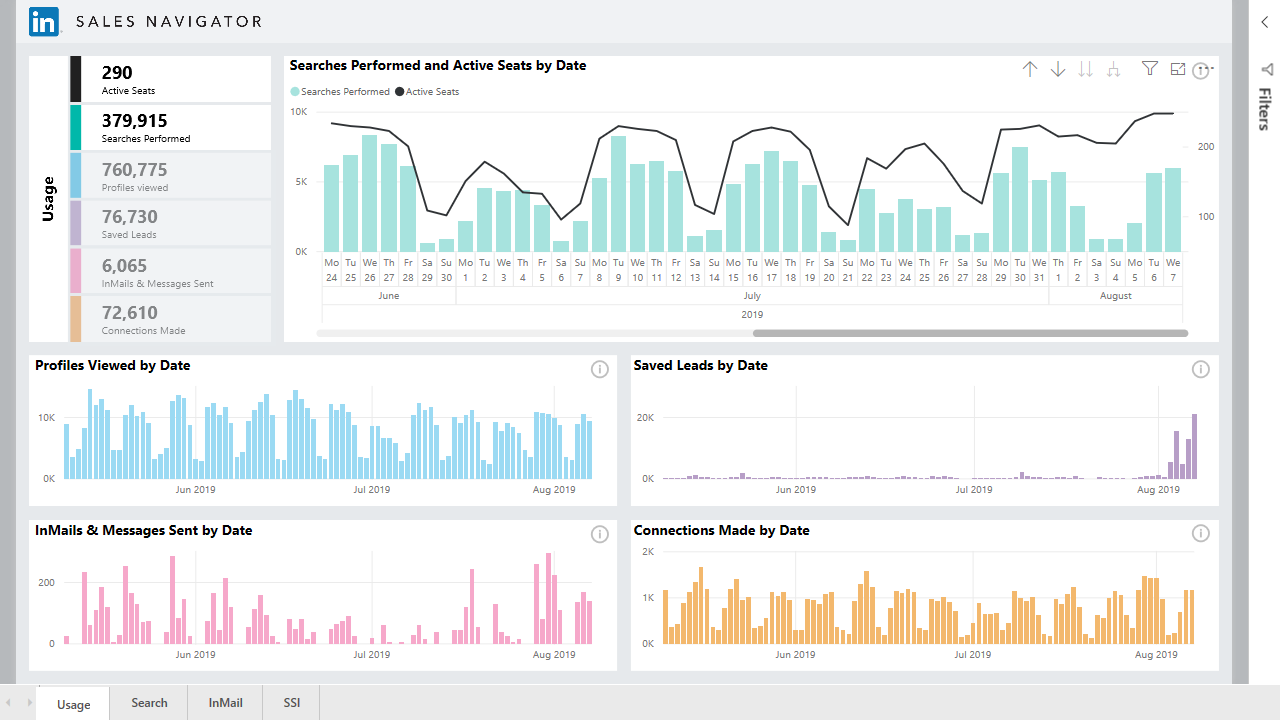
The usage tab will allow you to access user data and keep track of their:
- Days active: a user is counted in days active when they have accessed Sales Navigator or LinkedIn through desktop, email, the mobile app, or CRM widget.
- Searches performed: number of times a user has conducted a search on LinkedIn or Sales Navigator on the desktop or mobile app during the selected time period.
- Profile views: number of times a user hovers over or has viewed a profile on LinkedIn or Sales Navigator on the desktop, mobile app, or the CRM widget during the selected time period.
- Saved leads: number of leads a user has saved during the selected time period.
- Saved accounts: number of accounts a user has saved during the selected time period.
Step 4: Measure your team’s effectiveness
The Effectiveness tab will show how well your team is utilizing Sales Navigator to accomplish their Sales Goals. Their effectiveness is measured by their:
- InMail messages sent: total number of InMail messages that have been sent from Sales Navigator during the selected time period to members that the user is not directly connected to.
- InMail acceptance rate: percentage of InMails sent that have been accepted by a prospect within 30 days.
- Messages sent: number of messages that have been sent from Sales Navigator during the selected time period, sent to 1st-degree connections and don't require InMail credits.
- Total unique connections: aggregated count of Unique Connections across all Sales Navigator seat holders.
For a more detailed breakdown of each of these stats across your entire team, try exporting a report as a CSV file. (You can apply date ranges and group filters to reports as well.)
Step 5: Discover the analytics integrations available
If you’re an Enterprise license holder, you can integrate Sales Navigator with leading business intelligence applications Tableau & Power BI for even more insight into the behaviors that their best-performing reps are taking. For more information, please reach out to your LinkedIn Customer Success Manager or Relationship Manager.
Please share with us what you think of our current Usage Reporting dashboard and, as always, if you have additional ideas for new features, please submit them via the Community's "Ideas" page, which you can find on the Community's top navigation bar.
Additionally, feel free to leave a comment below to share how you're using Usage Reporting and how helpful it has been to show to important stakeholders and decision makers how your teams are levering Sales Navigator.
Thank you,
Nádia